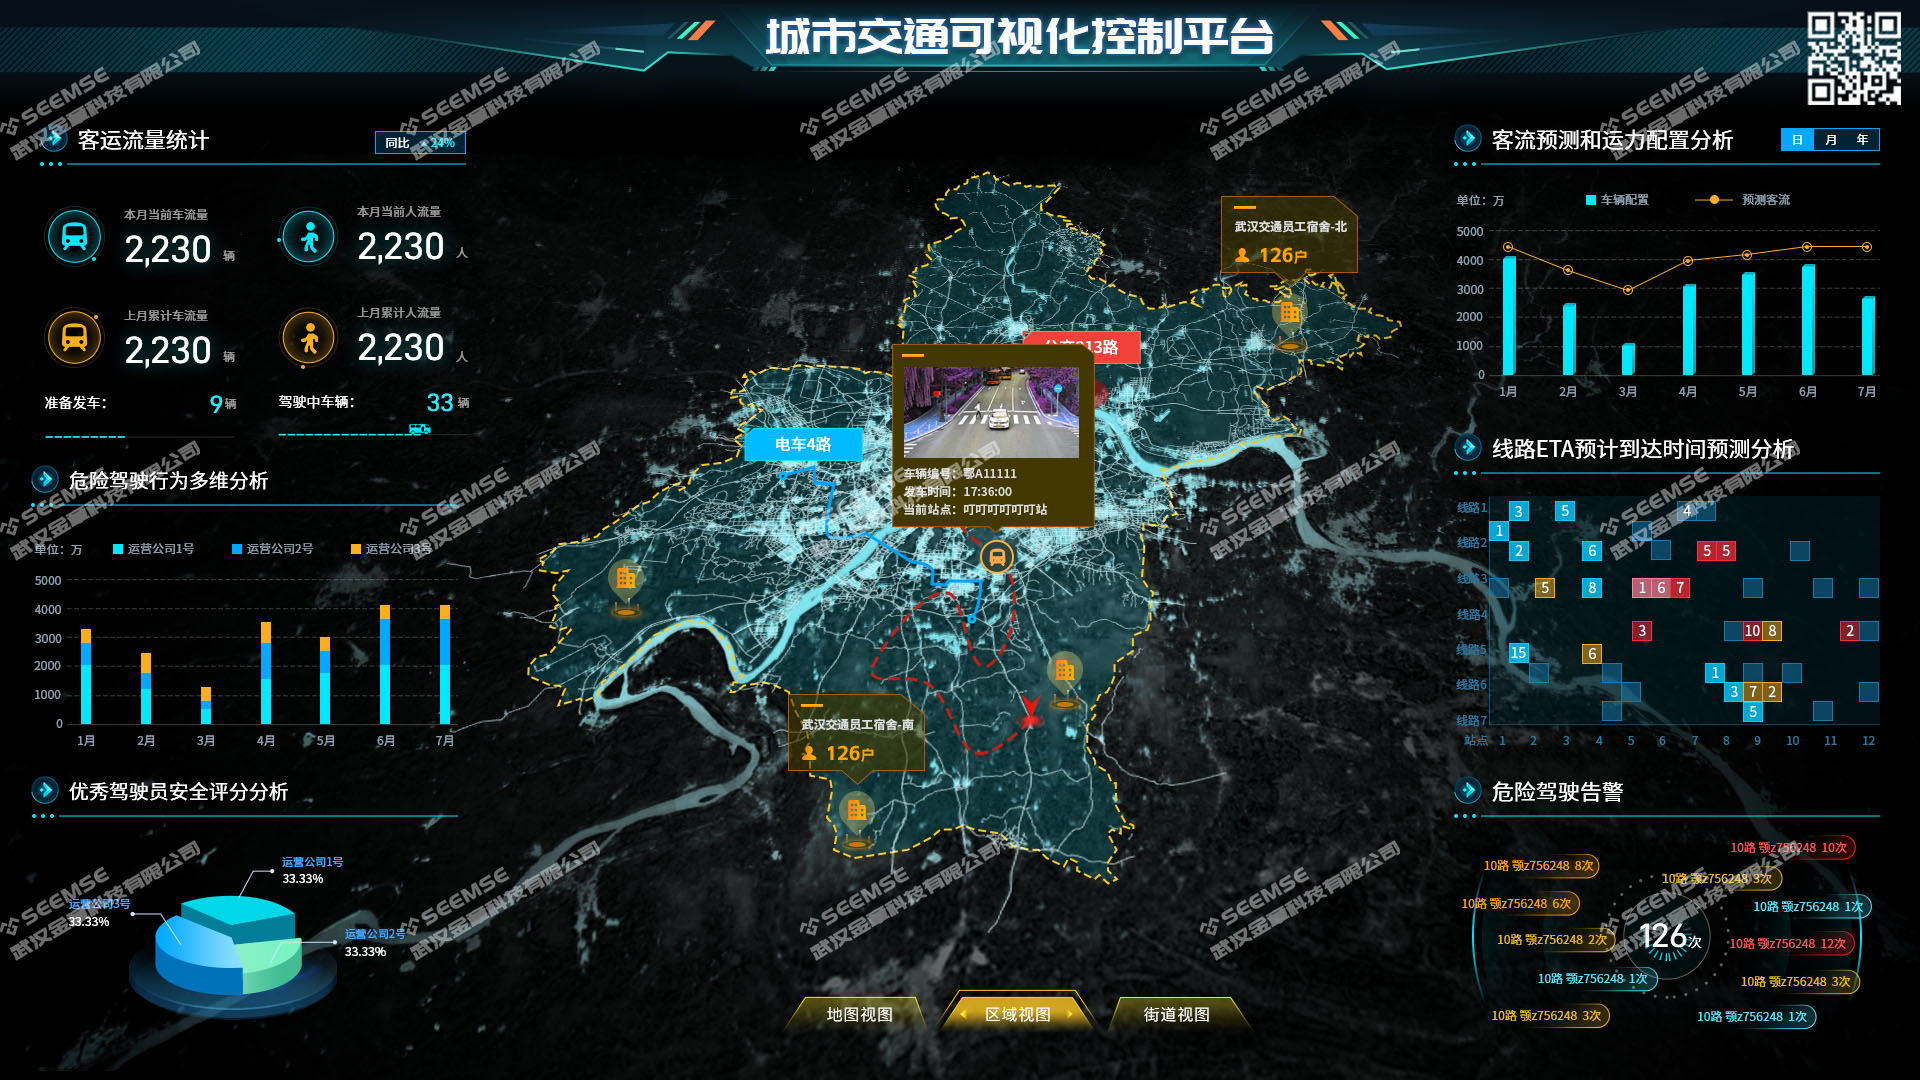
1. Urban Traffic Visualization Control Platform
The urban traffic visualization dashboard is an information display application based on data visualization technology. It can visualize urban traffic data in forms such as charts, maps, and animations, helping people understand and analyze urban traffic conditions more intuitively.
2. Smart Power Data Dashboard
The smart power data dashboard is a visual decision-making system developed to improve the digital and intelligent levels required in fields such as production, construction, operation and maintenance, and management of power enterprises. The system integrates new technologies such as big data, the Internet of Things, artificial intelligence, and visualization technology, and can visually present power management data in forms such as charts, maps, and animations, helping power enterprises understand and analyze power production, dispatch, and operation conditions more intuitively, quickly, and accurately.

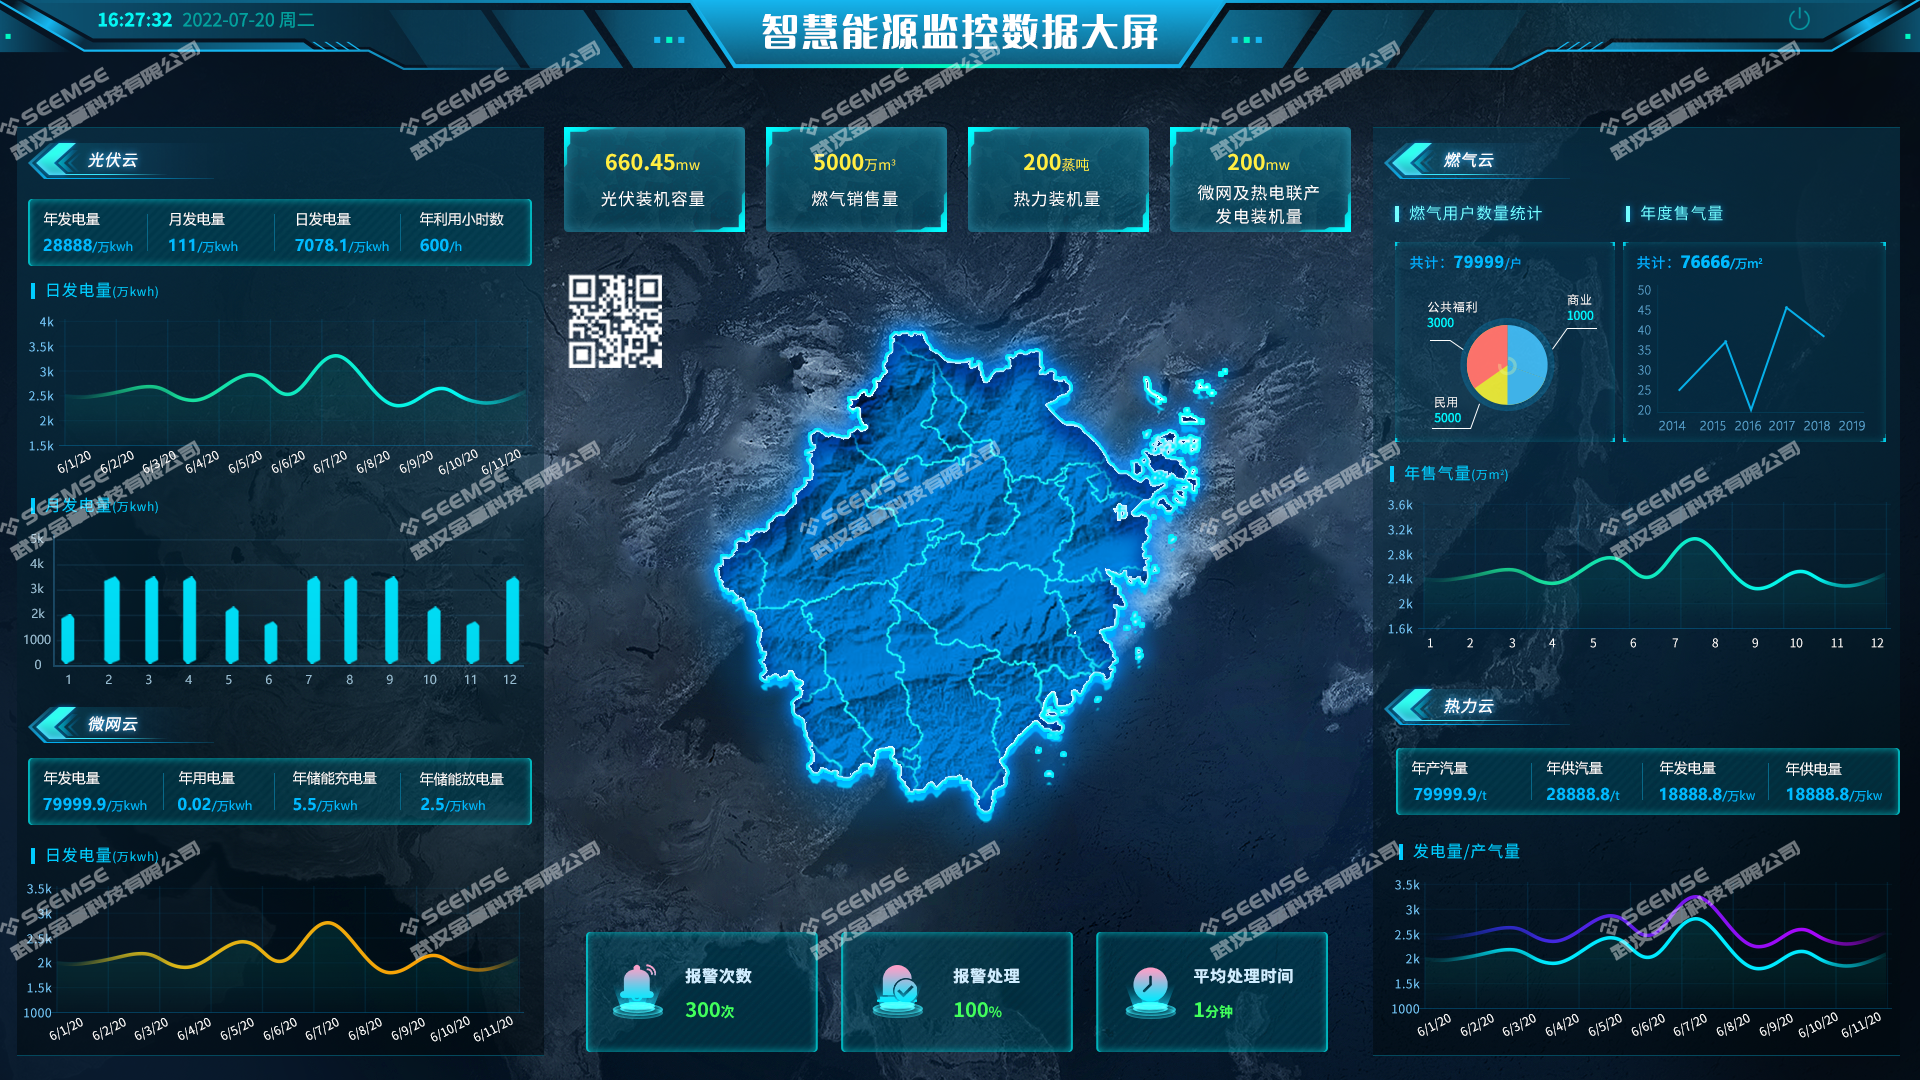
3. Smart Energy Monitoring Data Dashboard
The smart energy monitoring data dashboard is a decision support system that comprehensively applies advanced technologies such as the Internet of Things, big data, cloud computing, and machine learning. By collecting, aggregating, and analyzing energy consumption monitoring data, it can provide energy managers with more comprehensive and accurate energy consumption data and present it in visual form, helping various energy managers carry out refined operations and management.
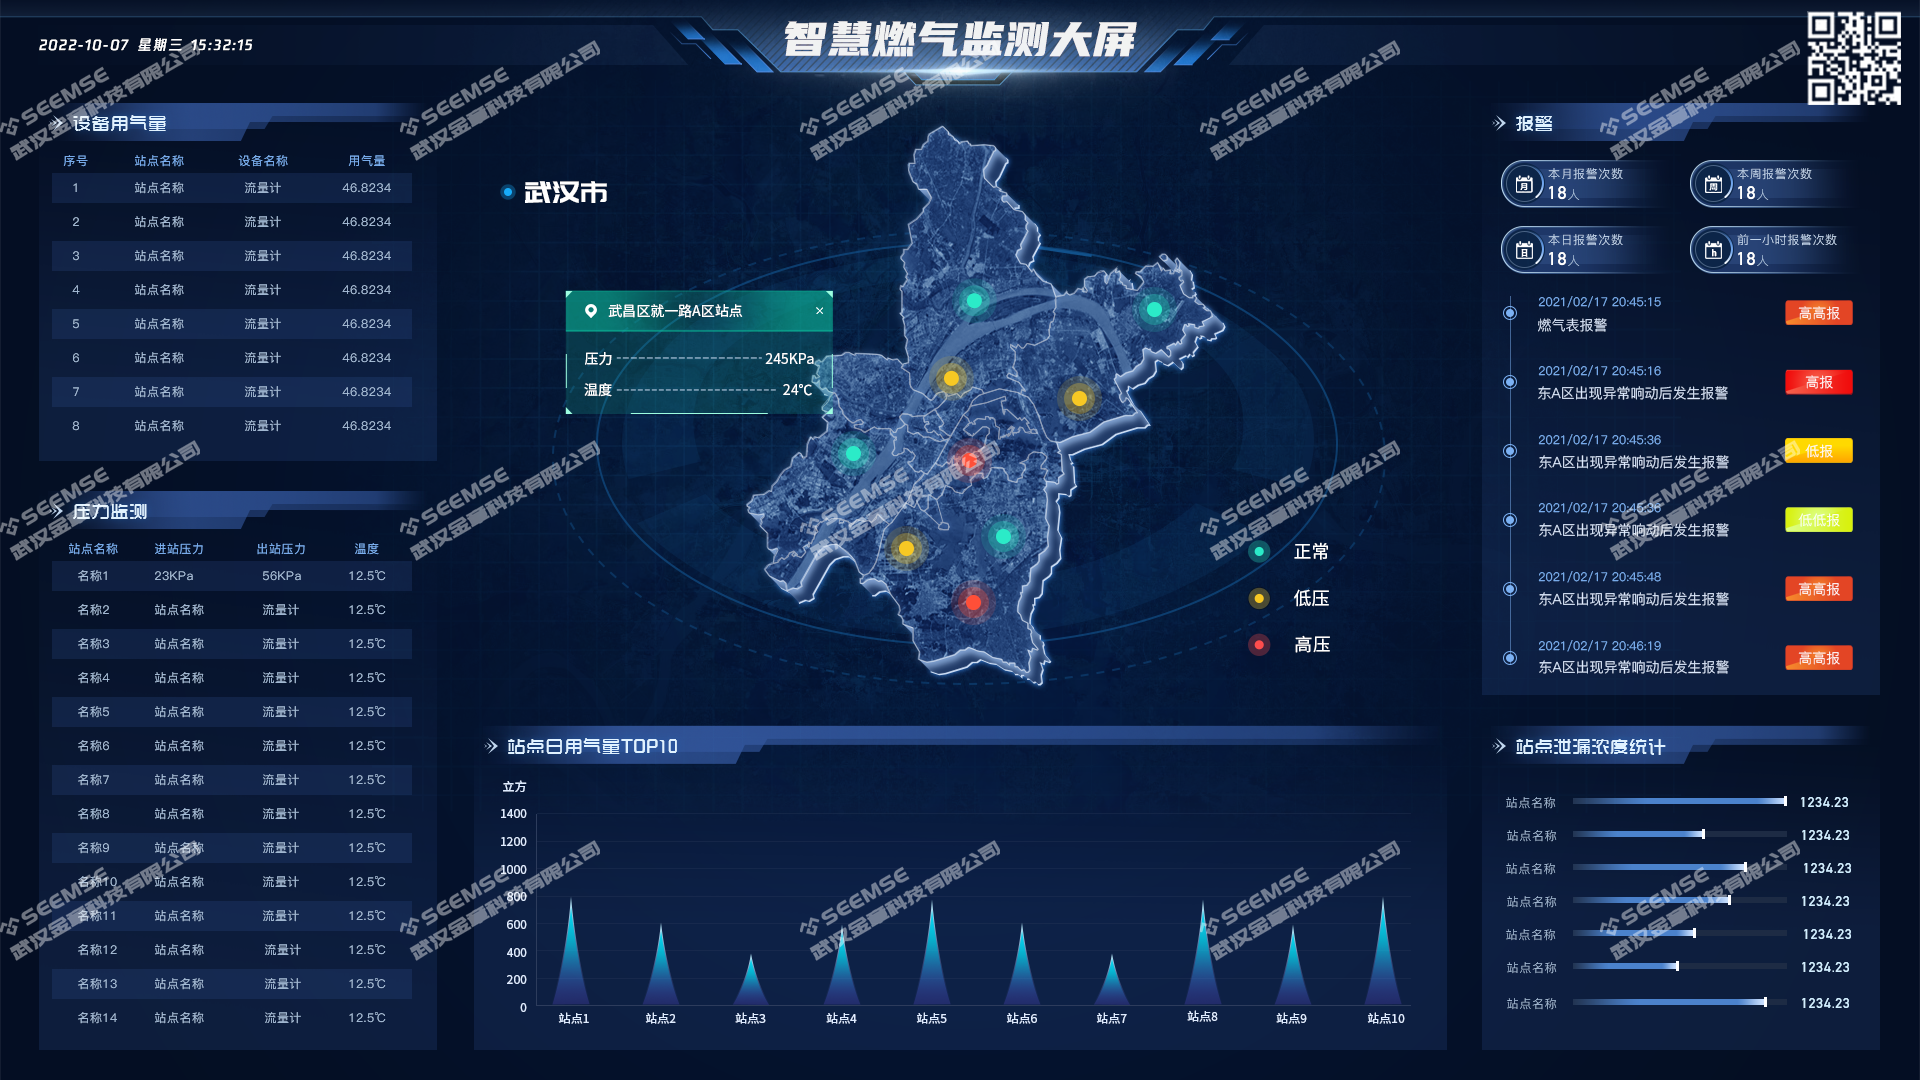
4. Smart Gas Monitoring Dashboard
The smart gas monitoring dashboard is a monitoring and management system based on Internet of Things technology, mainly used in the field of urban gas safety monitoring and management. By installing hardware devices such as sensors and controllers on gas pipelines and equipment, it performs real-time and accurate data collection and remote monitoring of the gas pipeline network, transmits the collected data to the smart gas monitoring dashboard platform, and presents it in a visual way.
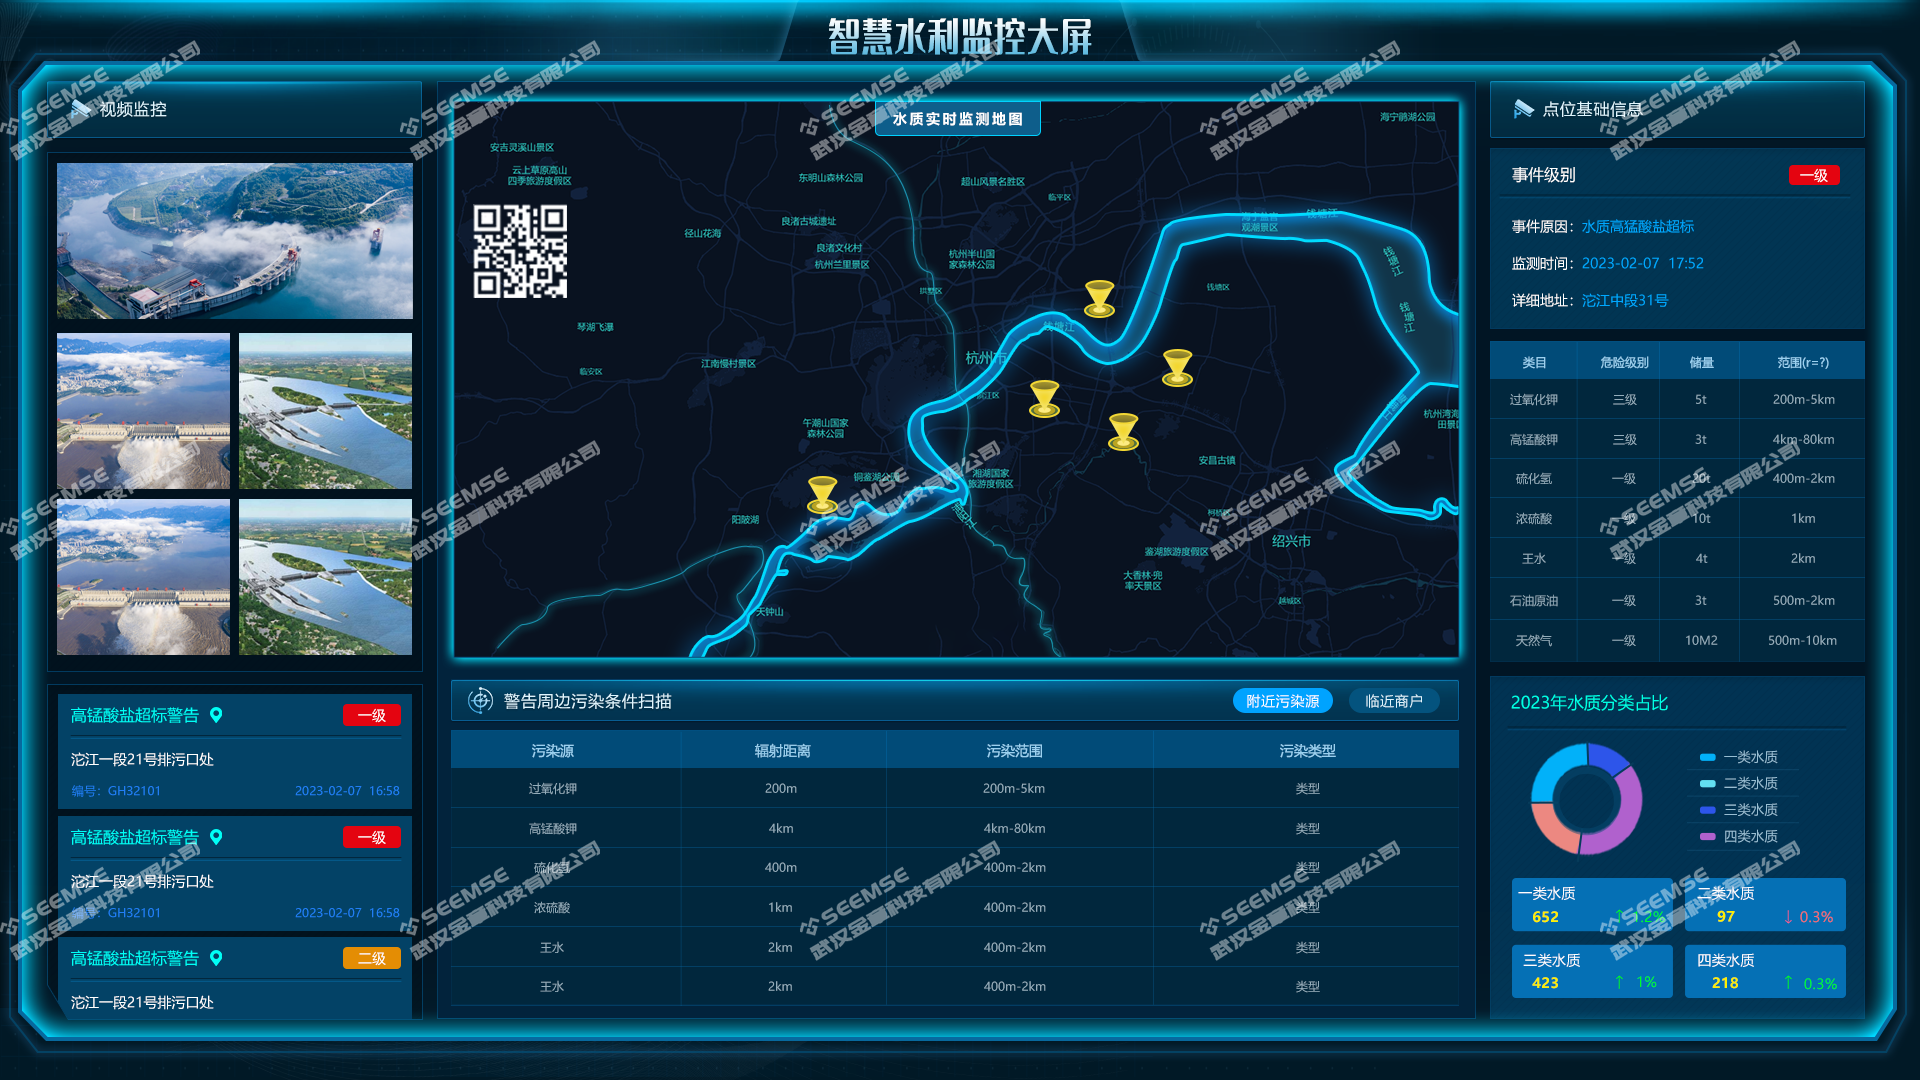
5. Smart Water Conservancy Monitoring Dashboard
The smart water conservancy monitoring dashboard is a monitoring and management system based on technologies such as the Internet of Things, cloud computing, and artificial intelligence, mainly used in fields such as water conservancy resource supervision and management and water conservancy project construction planning. The system can integrate the existing information system data resources of various water conservancy departments, cover various business areas of water conservancy management, and realize comprehensive water conservancy situation monitoring and visual management of water resources.
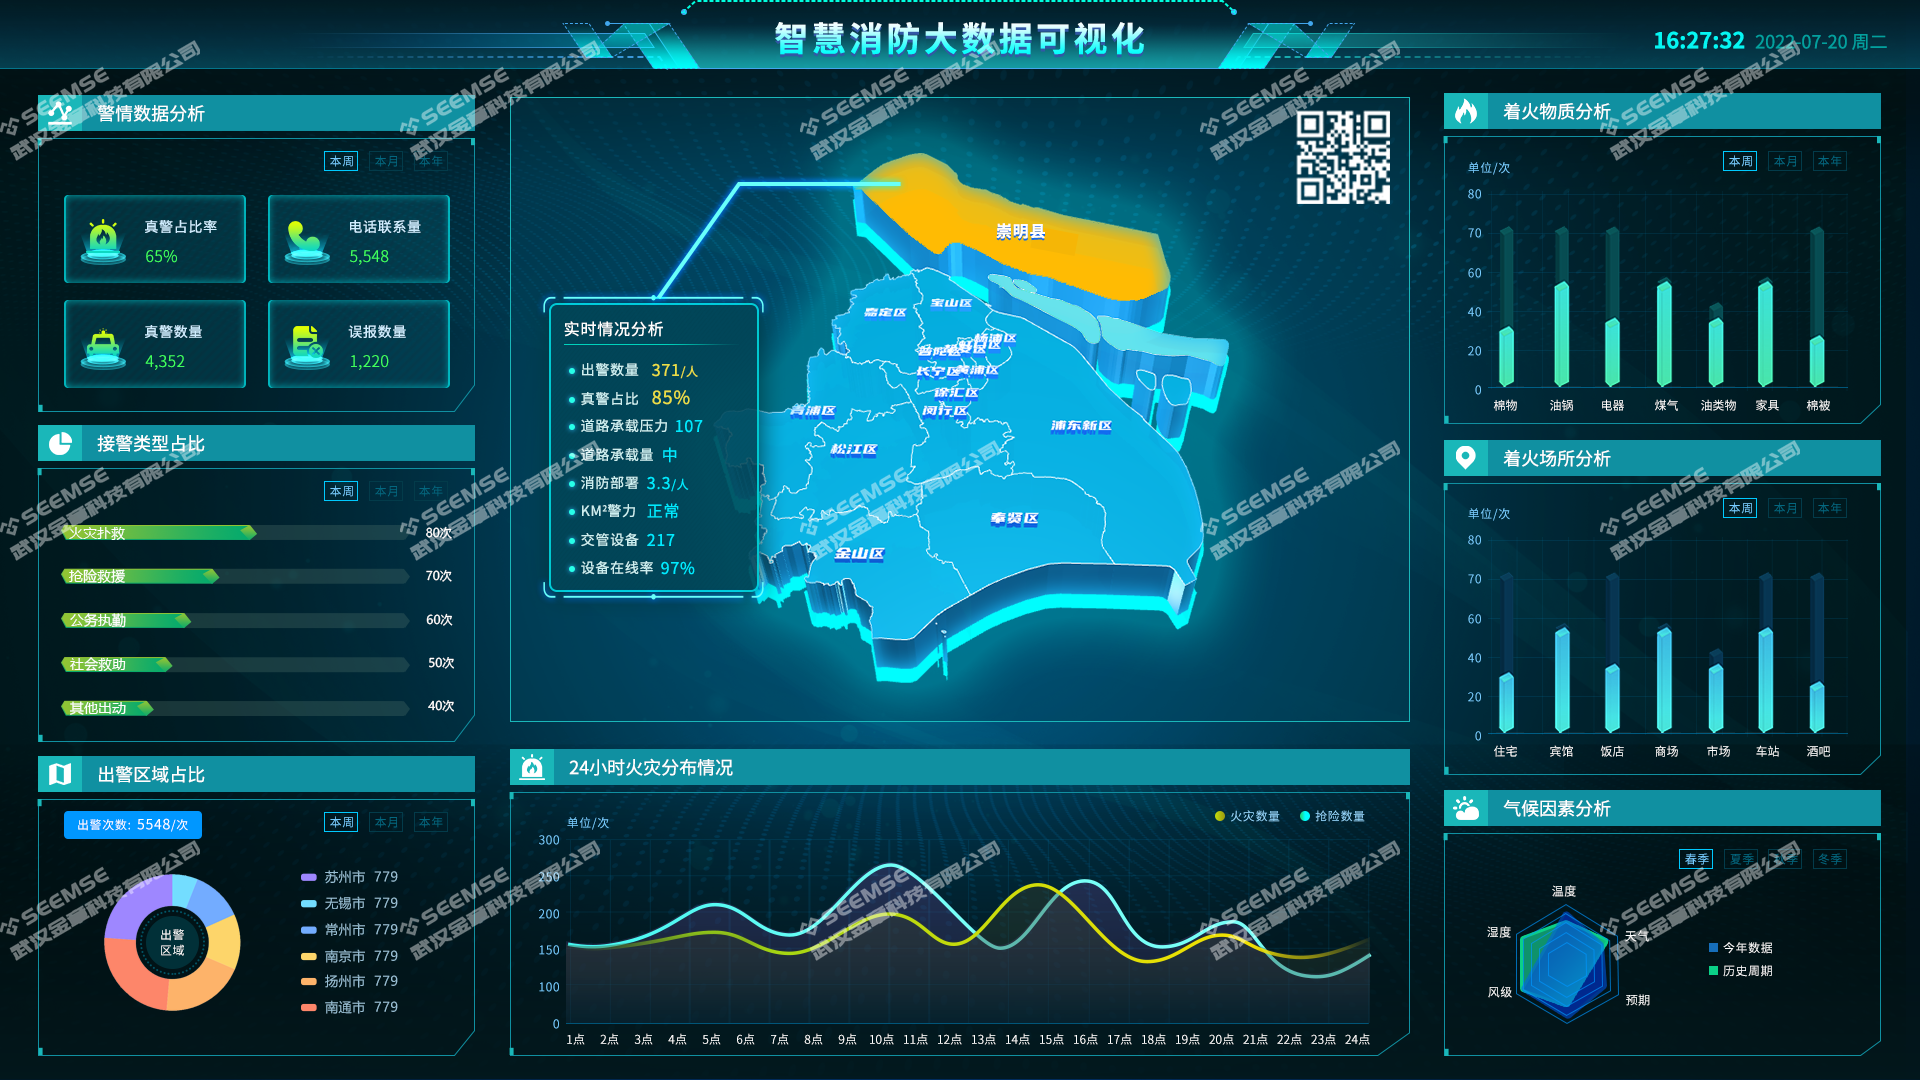
6. Smart Firefighting Big Data Visualization
Smart firefighting big data visualization is a monitoring and management system based on technologies such as the Internet, the Internet of Things, big data, and artificial intelligence, providing fire departments with comprehensive, visualized data analysis and decision support. By collecting data sources including but not limited to video surveillance and sensors, the system aggregates and analyzes various types of data in the firefighting field, uses data visualization technology to display various types of data in real time on the firefighting large screen, and helps fire commanders quickly and accurately grasp on-site conditions and make rapid decisions.
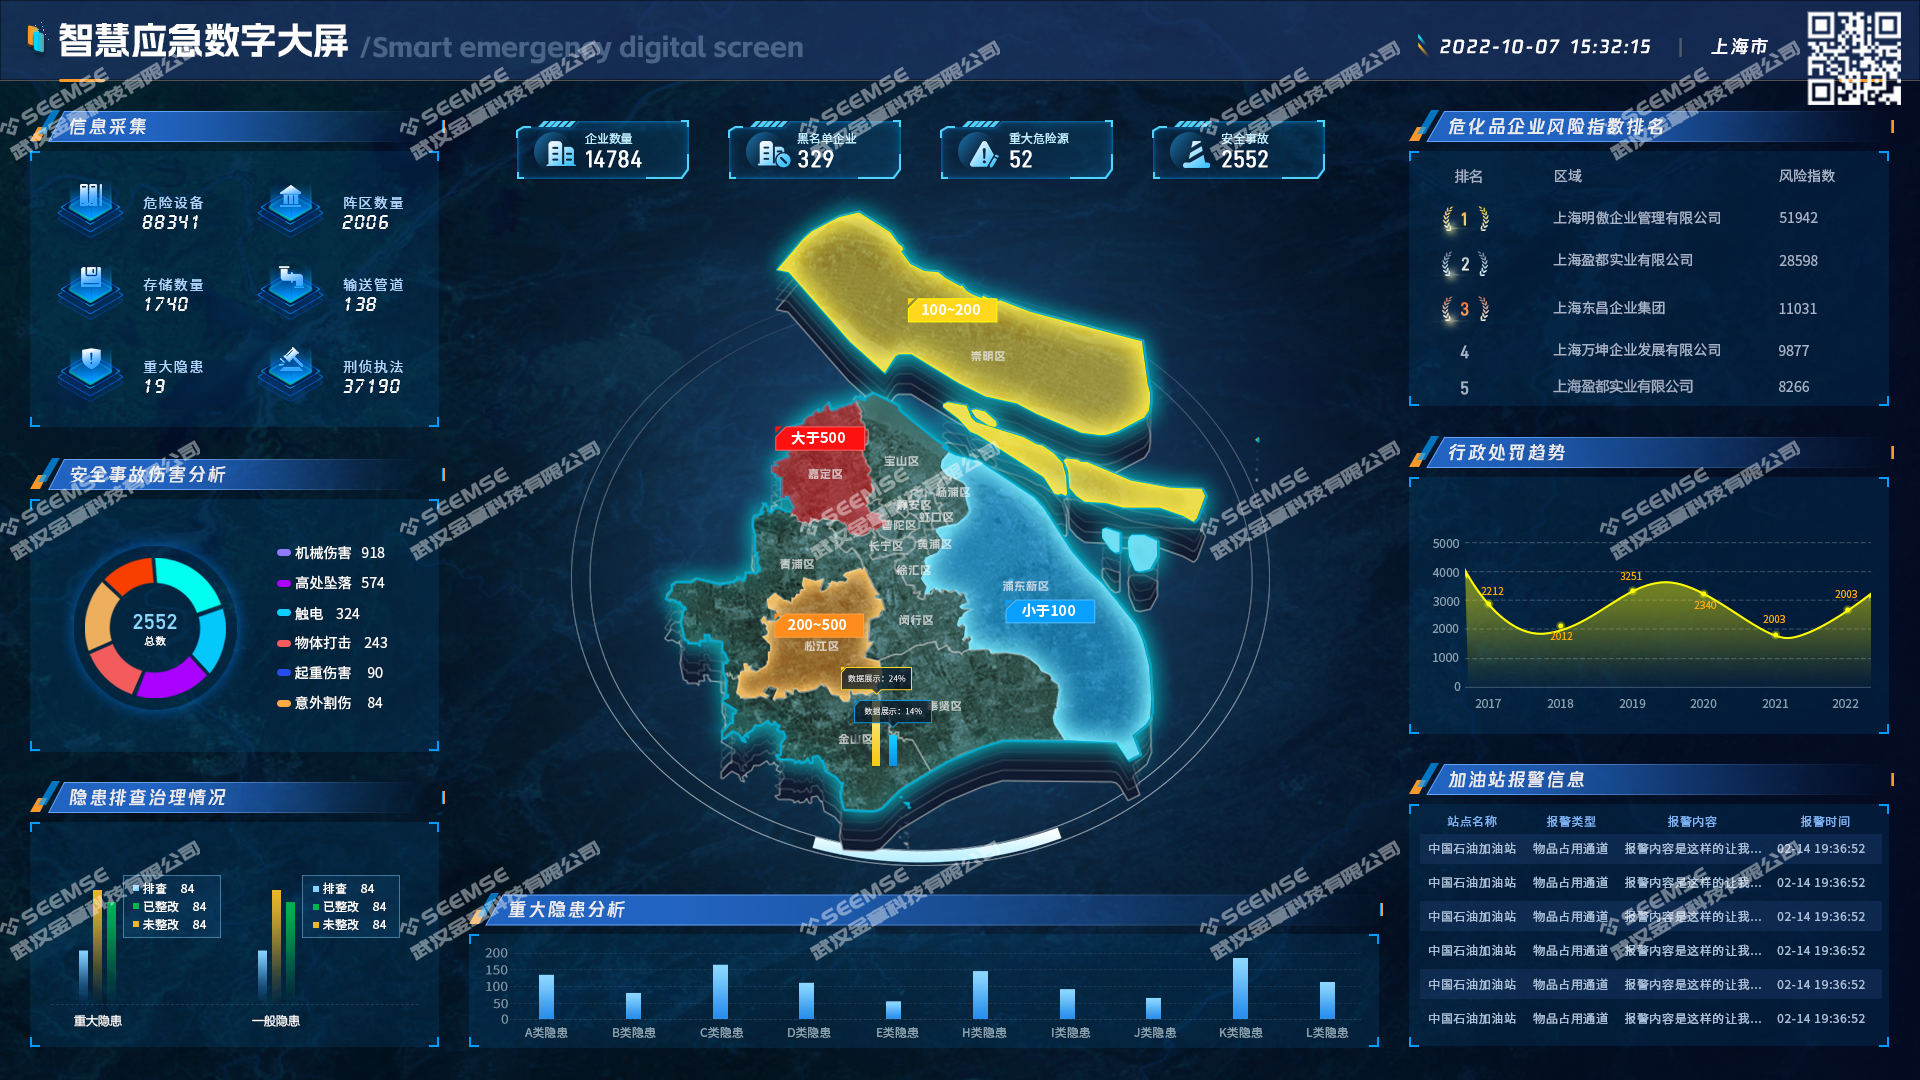
7. Smart Emergency Digital Dashboard
The smart emergency digital dashboard is a modern alarm and command center designed and produced based on information technology. The system mainly collects information through various data sources, aggregates, analyzes, and visually displays the data on a large screen to provide decision support and command dispatch.
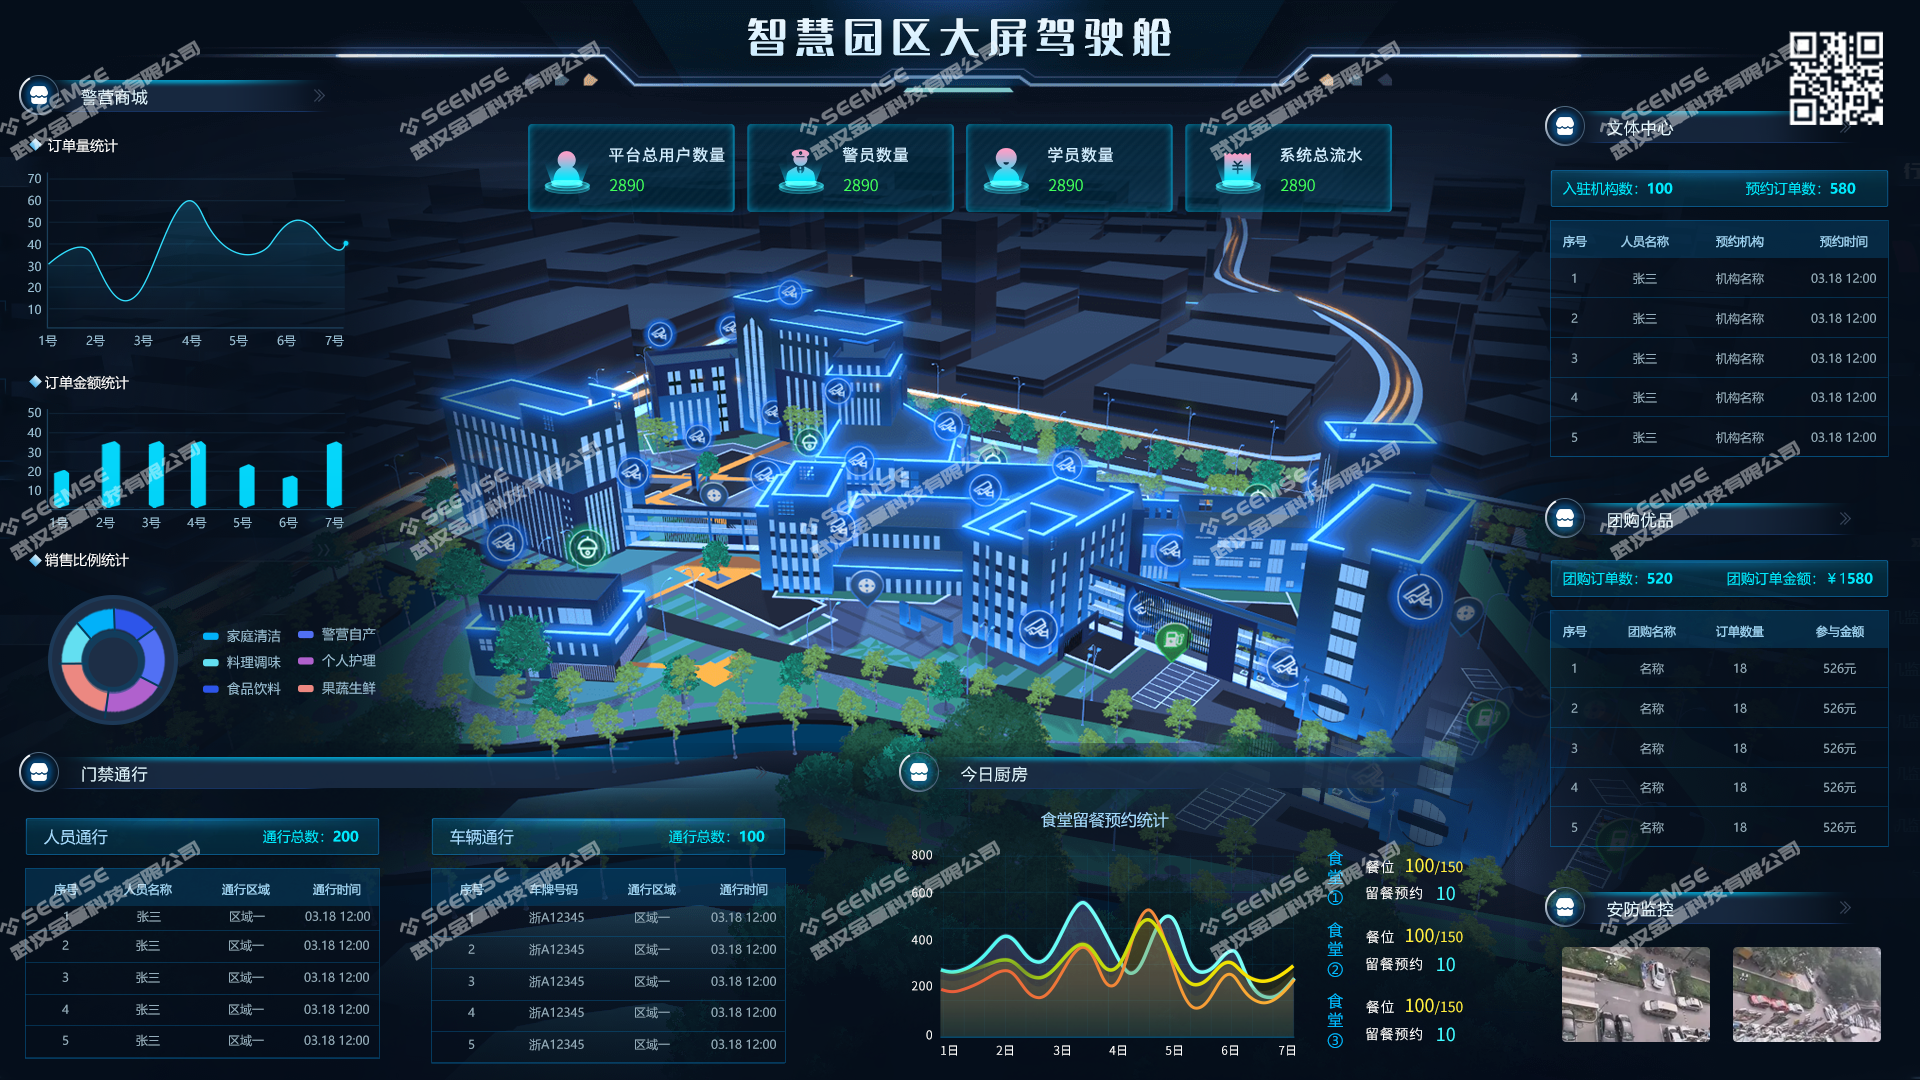
8. Smart Park Dashboard Cockpit
The smart park dashboard cockpit, also known as the park visualization system or park data cockpit, is a visual management tool based on digital twin technology and 3D technology. It intuitively and dynamically displays the spatial distribution, operating status, and statistical data of various buildings and equipment in the park through visualization. At the same time, it links various monitoring scenarios in real time, gathers the data information of each subsystem on one platform, and enables park managers to obtain all key information on one screen.
9. Future Rural Cockpit
The advantage of the future rural cockpit is that it can integrate various data sources and realize data sharing and interoperability; through data analysis and intelligent decision support, it can improve decision quality and efficiency; at the same time, through information publishing and interactive services, it can promote communication between the government and residents and enhance governance transparency and social participation.

10. Rural Governance Cockpit
The rural governance cockpit provides a comprehensive and scientific decision support platform through informatization means, helping decision-makers better understand and grasp the current situation and problems of rural governance, and promoting the modernization and refinement of rural governance.

11. Digital Village Visualization - Digital Governance
Digital village visualization - digital governance is a method of using digital technology and informatization means to improve the level of rural governance. Through methods such as data integration and sharing, visual display and analysis, real-time monitoring and early warning, and public participation and transparency, it helps decision-makers better understand and grasp the current situation and problems of rural governance and promotes the modernization and refinement of rural governance.

12. EMS Energy Storage Platform
The EMS energy storage platform realizes monitoring, management, and optimization of energy storage equipment through informatization technology and data analysis. It can provide comprehensive real-time data monitoring and fault diagnosis, helping operators take timely measures to ensure the safe operation of energy storage equipment. At the same time, the system can also perform energy dispatch and optimization management, improving the stability of the power system and energy utilization efficiency.

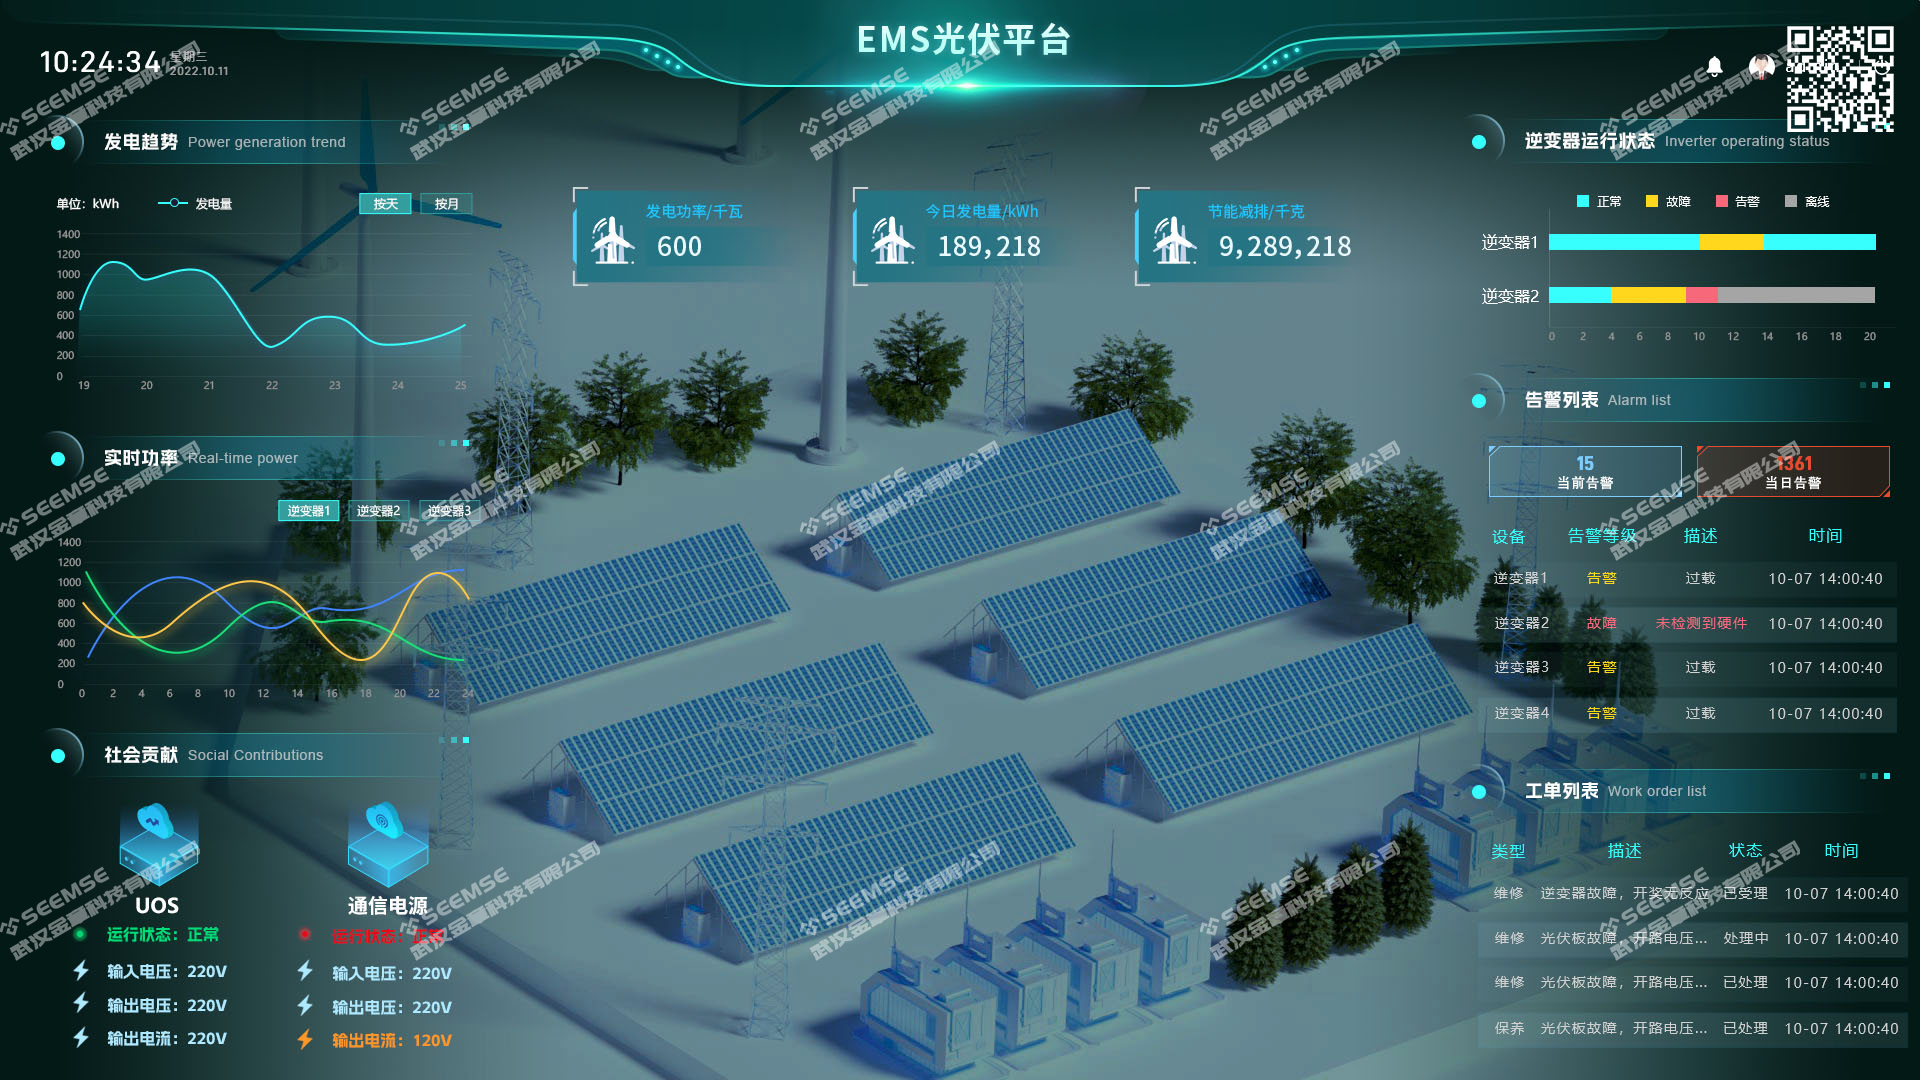
13. EMS Photovoltaic Platform
The EMS photovoltaic platform realizes monitoring, management, and optimization of photovoltaic power stations through informatization technology and data analysis. It can provide comprehensive real-time data monitoring and fault diagnosis, helping operators take timely measures to ensure the safe operation of photovoltaic power stations. At the same time, the system can also optimize power generation output and improve the power generation efficiency of photovoltaic power stations.
14. New Energy Vehicle Power Operation and Maintenance Platform
The new energy vehicle power operation and maintenance platform realizes monitoring, management, and optimization of charging facilities through informatization technology and data analysis. It can provide comprehensive real-time data monitoring and fault diagnosis, helping operators take timely measures to ensure the safe operation of charging facilities. At the same time, the system can also perform charging pile configuration and management, improving the use efficiency of charging facilities and user satisfaction.

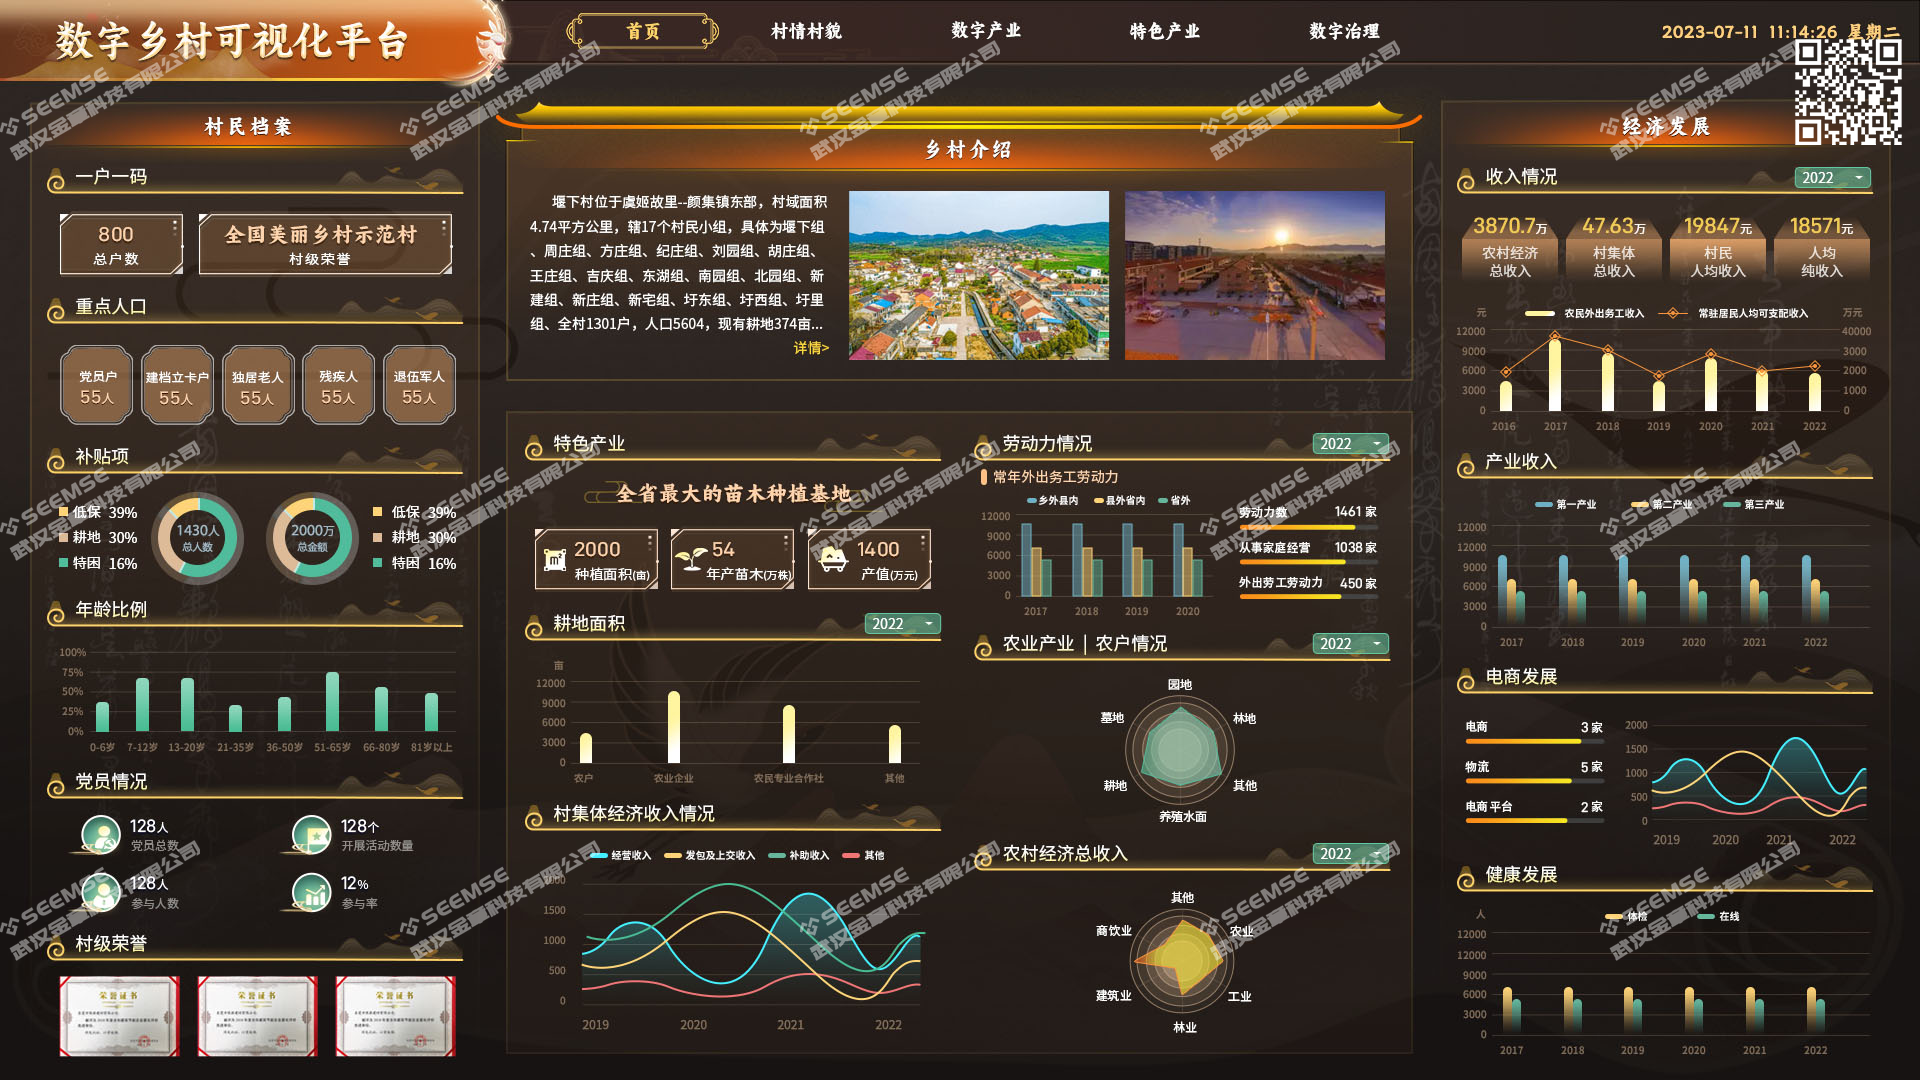
15. Digital Village Visualization Platform
The digital village visualization platform uses tools such as information technology and geographic information systems to display various data and information in rural development in a visual way, helping people better understand the current situation and problems of rural areas and providing support for rural planning and decision-making. It can provide intuitive and comprehensive information and promote scientific, sustainable, and intelligent rural development.
16. Smart Building Visualization Monitoring Platform
The smart building visualization monitoring platform realizes monitoring and management of various equipment and systems in buildings through information technology and Internet of Things technology. It provides functions such as real-time data display, equipment monitoring, energy management, and security monitoring, helping users fully understand the operating status, energy consumption, and security conditions of buildings, and providing data support to promote intelligent, efficient, and safe building management.

17. Smart Monitoring Visualization Dashboard Monitoring
The smart monitoring visualization dashboard monitoring system provides users with functions such as real-time data display, data processing and analysis, forecasting and early warning, and planning and decision support through information technology and data visualization technology. It can help users intuitively understand the changes and trends of environmental data and provide a scientific basis for decision-making in related fields.